IDENTIFYING THE MODULATION
Introduction
I would have liked these pages to be a comprehensive tutorial and "cookbook of recipes" for measuring and analysing an unknown signal to discover its mode of modulation, its method of carrying information and perhaps the identity of its users. The number of topics in such an undertaking is enormous, however, and many of them are outside of my own "expertise", so I have decided to confine these articles to some basic measurements and analytic methods that can be used by almost anyone. The usefulness of these methods is limited only by the care with which you make your observations and your desire to understand and to learn more. I hope that this approach will provide useful information to you and that some of my suggestions will inspire you to study an intruder more intensely and with more questions than you might have had at first.Identifying the Modulation
Identifying the mode of modulation and the method by which information is being carried by a signal is a mixture of both art and science, and even experienced signals analysts can be fooled by unusual methods of multiplexing and special combinations of keying speed and frequency or phase shift. Our goal here is not to completely and perfectly define the modulation of an unknown signal, but to describe it sufficiently well that another observer can uniquely recognize it from among the many intruding signals in our bands, and hopefully to find some clues about the users of the signal, clues which might lead to identifying the source of the signal.There are two basic approaches to describing the modulation of a signal:
- describe how the signal was generated at the transmitter, or
- describe how the signal appears on the air, at the receiver of a distant observer.
The basic tool for analysing an unknown signal is your ear, and if you have an understanding of the fundamental differences between amplitude modulation (AM), frequency modulation (FM) and phase modulation (PM), and have some experience in hearing different signals on the Amateur bands, then you have all you need to begin. Of course, modulation of a carrier wave by analog information, such as AM and FM voice and music, is easy to identify, so we will be concerned mostly with digital signals.
To Begin Analysis
To begin analysing an unidentified signal, set your receiver in CW or SSB mode and tune slowly through the signal, listening to the different parts of the signal as they pass into and out of your receiver's passband. I recommend adjusting the beat frequency oscillator (BFO) to place the zero-beat point near the center of the receiver bandpass, in other words, adjust the bandpass tuning to include audio tones on both upper and lower sides of zero- beat within the passband. In this way, you can hear the low audio tones associated with those components of the signal that are near zero-beat in your receiver. With practice you will be able to ignore the higher frequency sounds. It sometimes helps to use a narrow IF bandwidth, if your receiver has one, and it is better yet if it can be adjusted so that you hear the zero-beat point near the center of the passband.It is still OK if your receiver can not be adjusted in this way. You will simply have to concentrate harder to hear the components of the signal spectrum at their lowest possible beat frequency or lowest audio tone, as you tune through the signal. Your ability to separate tones of nearly the same frequency will be best at these lower audio frequencies.
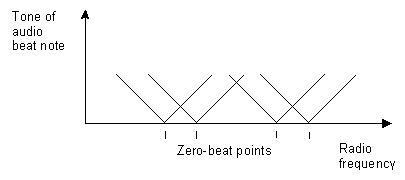 As you tune slowly through the signal, you will hear in succession each of the different spectral components of the signal as they pass through zero-beat, or near it. Note the frequency on your tuning dial where each of the components is at zero-beat.
The diagram at right is a graph of what you might hear as you tune through a hypothetical two-channel multiplexed frequency-shift-keyed (FSK) printer signal with a frequency shift of, say, 170 Hz and a spacing between channels of, say, 600 Hz.
In this way, you will be able to answer such questions as:
- How many components are there in the signal?
- Are they spaced equally in frequency?
- Do they come in equally-spaced pairs? (Possibly indicating multiple FSK printer or data channels)
- Is there a component in the center of the signal, or at one side of the signal, that might be a carrier? (Possibly indicating a full-carrier double or single sideband AM signal)
- Are most or all of the components symmetrically placed with respect to the carrier frequency? (Strongly indicating a double sideband AM signal)
- Do the spectral components turn off and on quickly (like ones and zeroes in a stream of data) or are they constant audio tones?
- Is each spectral component a single tone, or is it a narrow band of noise? (Bands of noise can indicate phase-shift-keying, PSK)
- Are there tones imbedded in each band of noise? (Two tones imbedded symmetrically in a band of noise can indicate "minimum-shift" FSK, or some PSK signals while in "idle" condition)
If you found, for example, three pairs of components, with the tones in each pair separated by about a quarter of a kilohertz (say, 240 Hz), and each pair spaced by almost a kilohertz from the next pair (say, 960 Hz), then you have probably found a 3-channel multiplexed frequency-shift-keyed printer signal similar to the infamous Russian military printer which occupied 14126 kHz for several years.
Or, if you found a number of strong components (often called spectral "lines"), equally spaced at about ten per kilohertz (100 hertz spacing), with a single weaker component or line in between many of the pairs of strong ones, and with no apparent carrier frequency, then you might be listening to one of the Iranian "hum" or buzz jammers which inhabit the 40 m band.
Or, if you found no tones but instead 8 narrow bands of noise spaced 300 Hz apart with a 450 Hz space in the center, then you are almost certainly hearing a multiplexed PSK encrypted data or speech signal, similar to one used by the Russian and Chinese military.
Now I think you can see how useful it is to be able to measure the number of spectral components, the number of apparent data channels, their spacing in frequency, and other technical characteristics of the signal.
Even a Cheap Oscilloscope Will Do
So far we have discussed observing a signal mostly in the "frequency domain", but it is useful, and sometimes essential, to observe a signal also in the "time domain". For this you need to have a very good ear and a fast brain. Since I have neither of these, I find that an old audio oscilloscope is a good tool. Although a 'scope with a triggered display and a calibrated time base would be excellent, almost any old 'scope is useful and in fact I used a very simple one for many years with good results. Simply connect the audio output of your receiver to the vertical input of your oscilloscope. The effectiveness of a simple 'scope' depends more on how you use it and how you adjust your receiver to hear or view signals, than on any fancy features of the oscilloscope itself.Having already tuned slowly through the signal to find the frequency of each of the components in the signal's spectrum, now tune through the signal again while watching the display of your oscilloscope. First adjust the receiver to its most narrow bandwidth in CW or SSB mode, then set the BFO or the passband tuning so that you hear only high audio tones (beat notes) while listening to the signal. In this method these higher beat notes are preferred because they give each spectral component of the signal a more clearly defined shape or envelope in time than a lower audio tone would give. (Try it; you will see what I mean)
You might notice that the different frequency components of the signal turn off and on rapidly, like the 'marks' and 'spaces' (or ones and zeroes) of an RTTY signal. Or you might find that some components seem to change or wobble slightly in frequency or in phase (can you tell which it is?), and that your 'scope can not lock onto the waveform to produce the kind of stable display that you might be used to seeing. Of course, the bandwidth of your narrow filter and the tuning of your receiver will affect what you see here.
Try changing the tuning to put a component of the signal right on the edge of your receiver's bandpass in order to see small changes in frequency. In this situation, frequency changes at the receiver's bandpass filter will be translated into amplitude changes on your 'scope. By the way, this trick is a variation of "slope detection", an old method of demodulating analog FM signals with an AM receiver. Naturally, it worked best with old filters having wide instead of "steep" skirts.
If you listen to the signal in AM mode, instead of using a narrow bandwidth in CW or SSB mode, you might find that there is a predominant "tone" to the signal, which varies in phase but not in frequency. Measure the period or frequency of this tone; it will tell you something about the basic structure of the signal. For example, the Russian 3-printer signal on 14126 kHz had a basic tone of 960 Hz (and 1920 Hz), arising from the three FSK printer channels sending identical traffic in parallel, so that at any one time only Marks were transmitted on three frequencies or Spaces were sent on three other frequencies. The tones came from one Mark beating with the other two Marks or the Space beating with the other two Space frequencies. By the way, this signal is an example of frequency division multiplexing (FDM), with the three channels "strapped together", all sending the same traffic at the same time (described as being "in parallel").
So?
So, have we identified the modulation? Well, not completely, but I hope that the above techniques and tricks will help you to decide whether the signal is AM or FM and, in the case of digital signals, will help you to see how many channels of data are being transmitted and, in the case of FSK signals, the frequency shift and channel spacing. All of these characteristics are useful to describe a signal so that other monitors can tell if the intruder they hear is the same as "yours".Don't be afraid to experiment with these methods of observation. Examine some digital signals from Amateur stations. Compare them with signals outside the Amateur bands (remember, any of these non-Amateur signals might one day become an intruder). Experiment. Learn. Talk with other monitors about what they observe. And send your intruder loggings to your national MS co-ordinator. Your observation of a particular signal condition at a particular time on a particular day might provide a key piece of evidence that will positively identify the intruder.
If you found some of the above discussion difficult, don't worry, it will get easier, especially if you "play with these ideas" using your own equipment setup. The next article will give some examples of using an inexpensive computer spectrum analyser to display the spectrum of unidentified signals.
Return to Techstuff index page